Skip to content

The complete valuation workspace for mining stocks.

Value any miner, mine by mine. Change any input and watch the value move.

Read the methodologyView a worked example
Overview

Illustrative grade (g/t Au)

  • 0.1 – 0.3
  • 0.3 – 0.5
  • 0.5 – 0.7
  • 0.7 – 1.0
  • ≥ 1.0
Drag to rotate. Illustrative model on synthetic data, not a real deposit.

Go one level deeper at every step.

Scroll to descend through the same deposit. Each level of the model is a stage of the OreScore valuation, from the surface to the scenarios.

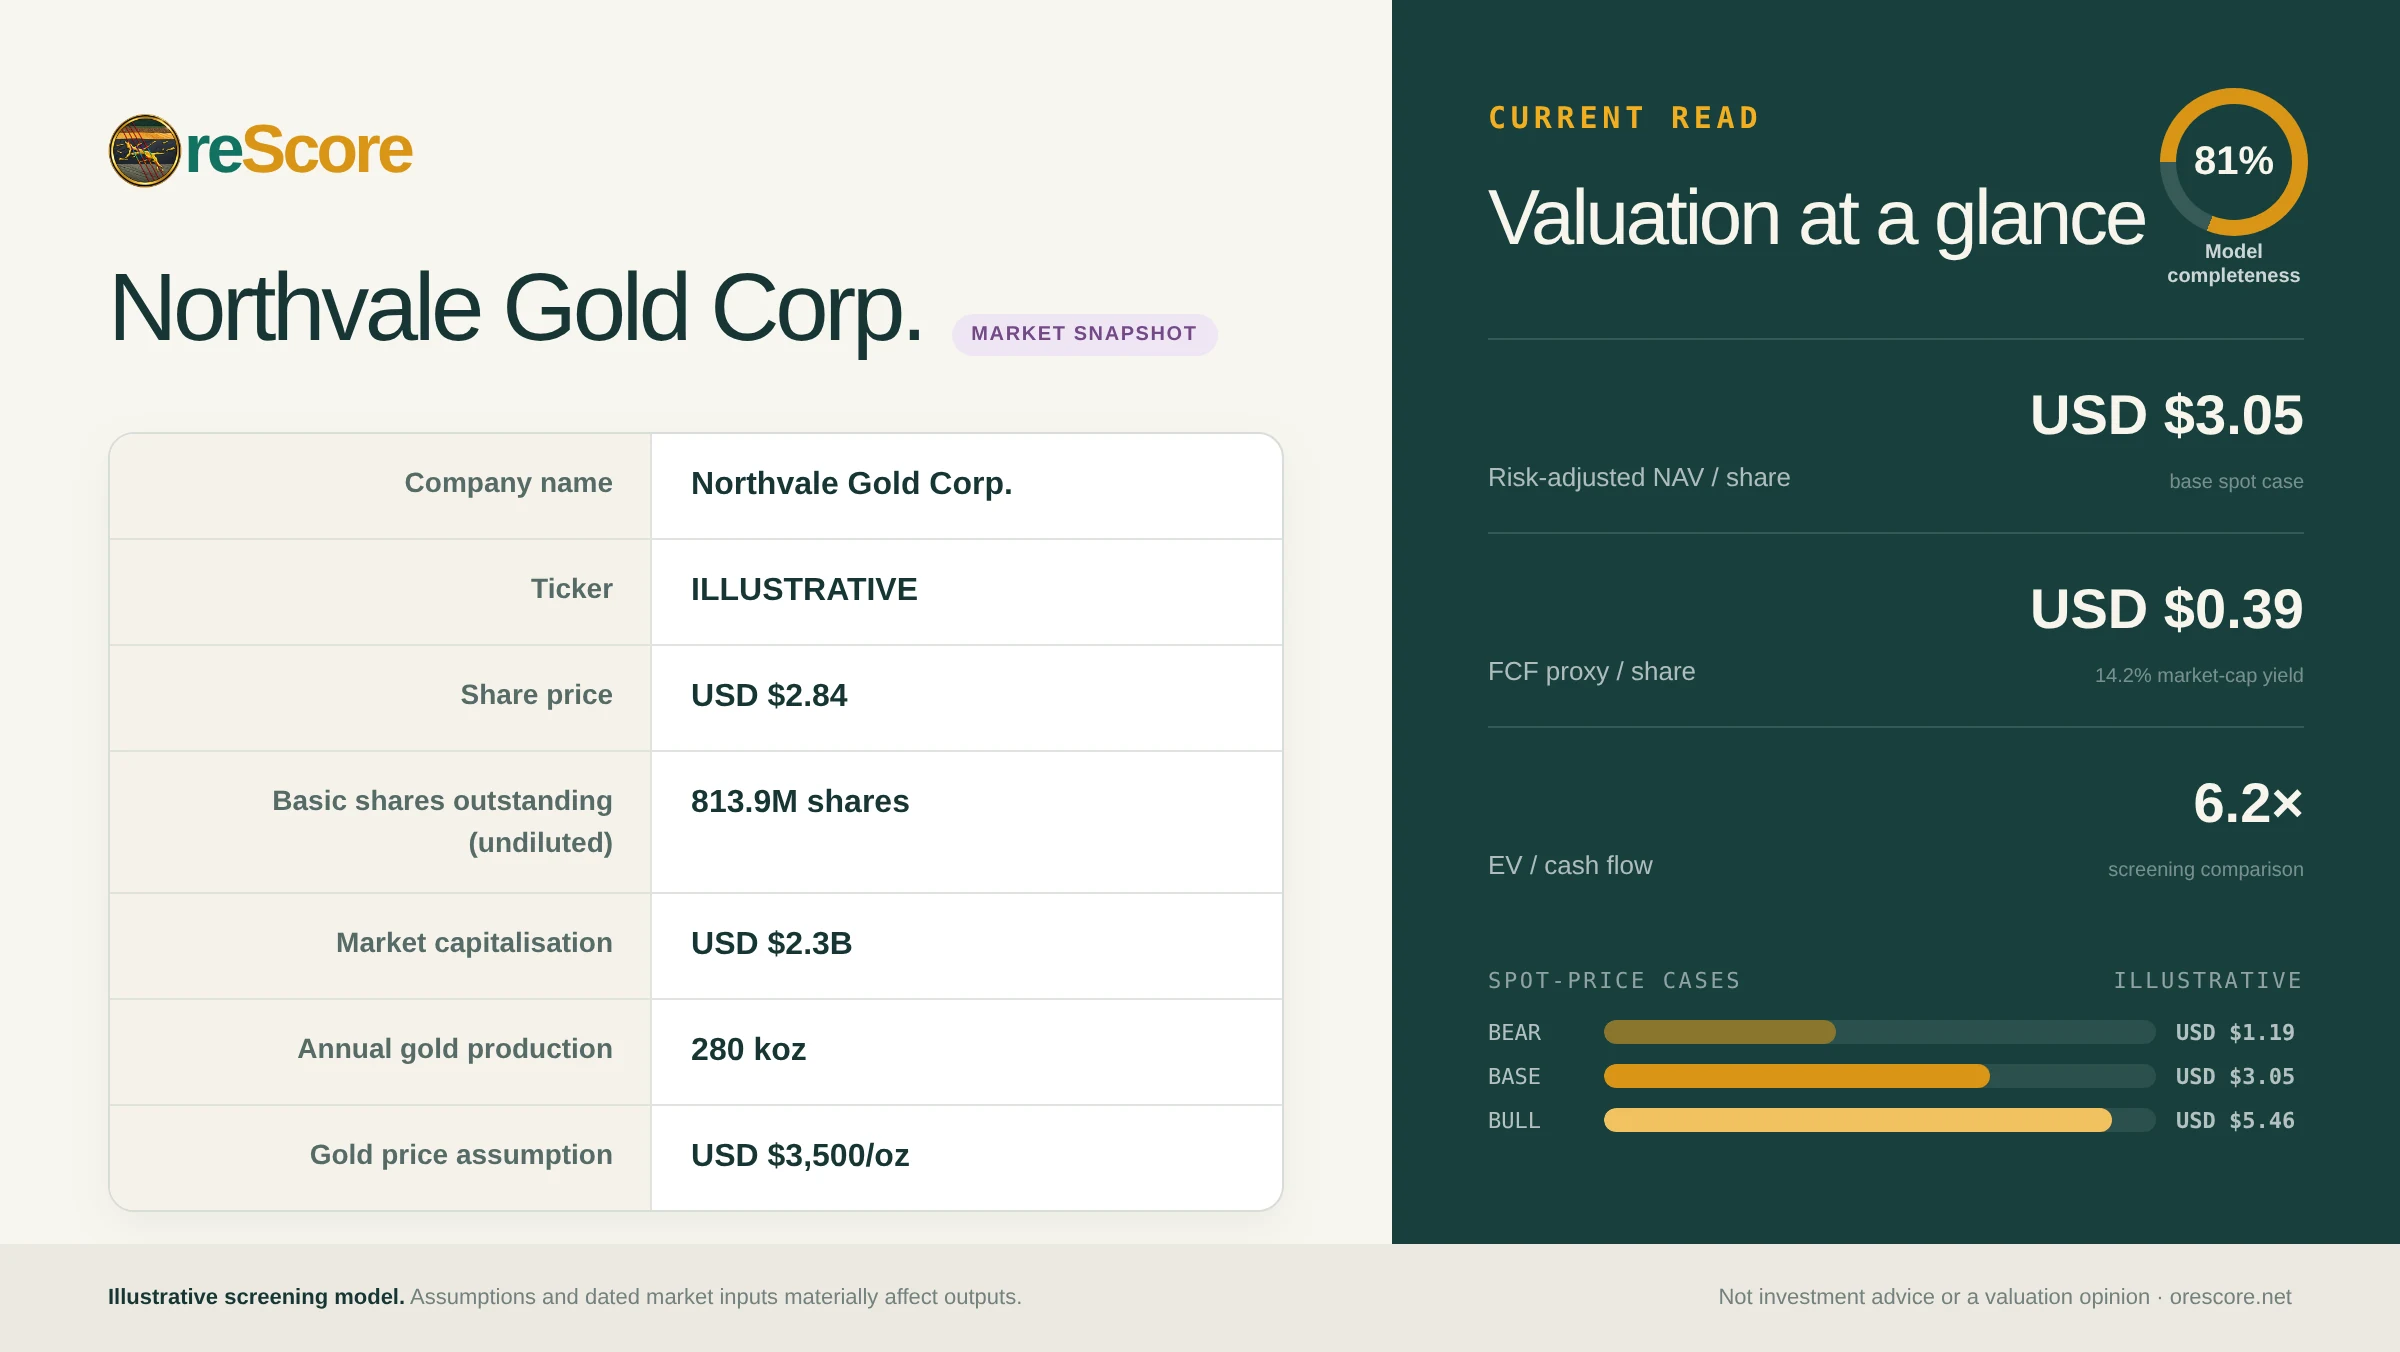
Market snapshot

Surface

  • Drill collar
  • Topographic contour
Drag to rotate. Illustrative model on synthetic data, not a real deposit.
Free

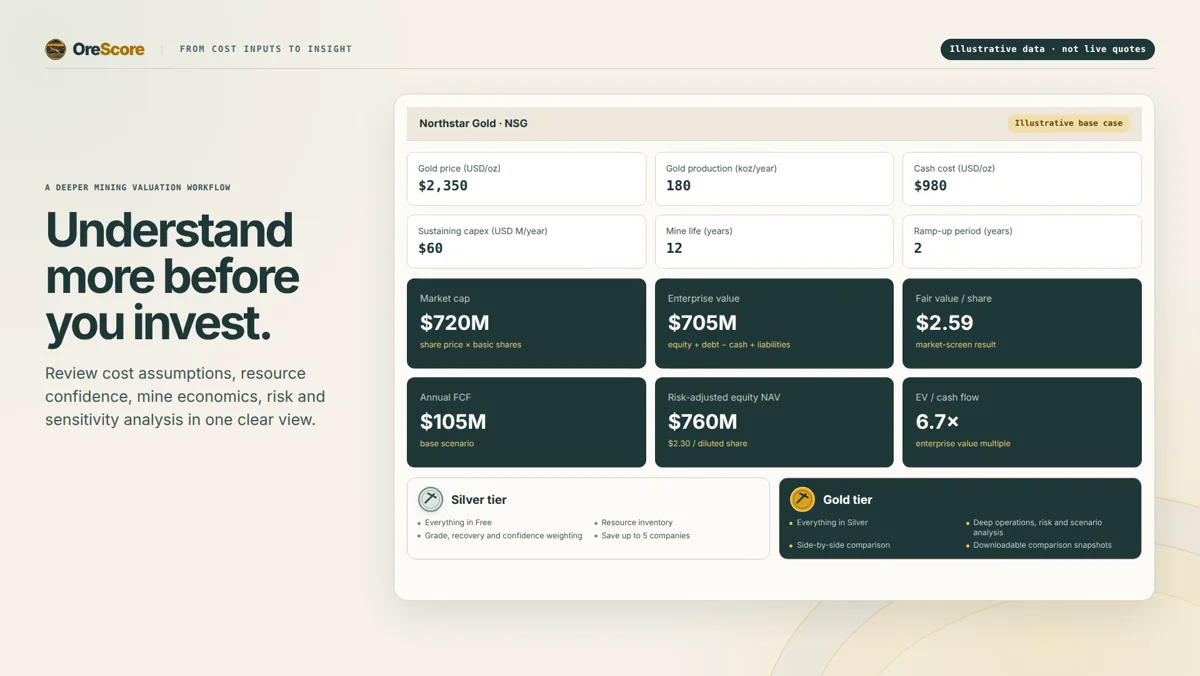
Market snapshot

Start from the share price. Shares, debt, cash and production become the market’s view of the company in seconds.

  • Market cap, enterprise value and EV per ounce
  • Model value per share from a cash-flow multiple you set
  • FCF per share and EV / cash flow
Silver and Gold

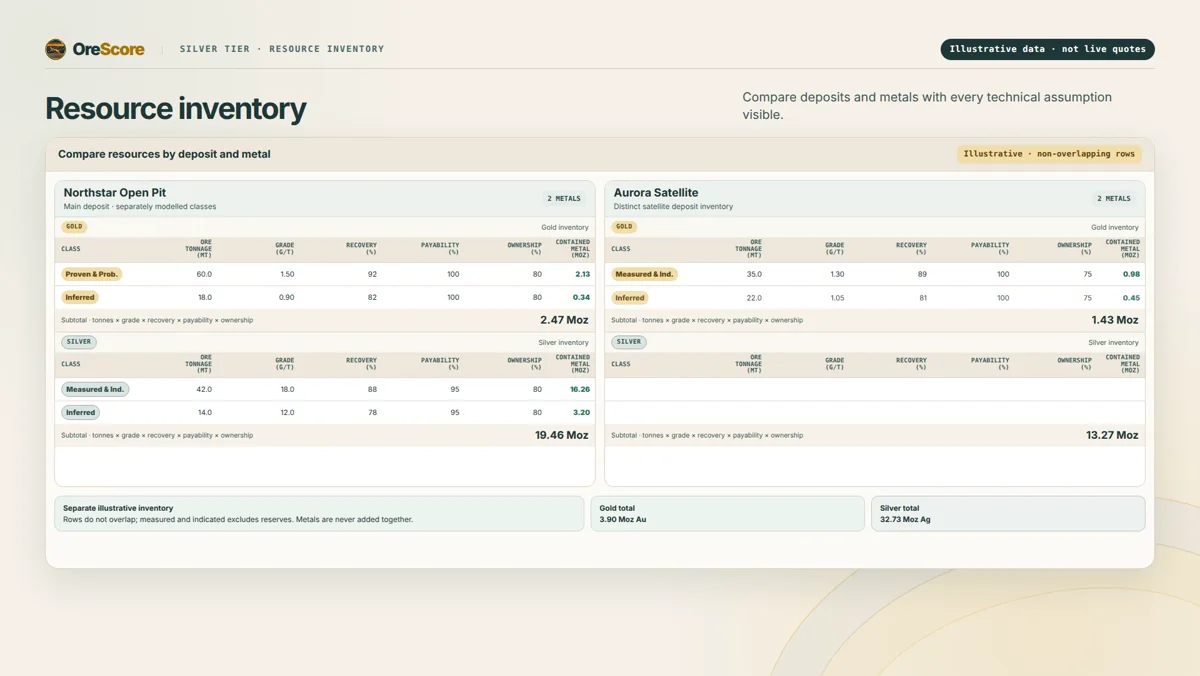
Resource inventory

Every deposit in one ledger: reserves and resources by mine, metal and category, attributable to the company.

  • Proven and probable, measured and indicated, inferred
  • Tonnes, grade, recovery, payability and ownership on every line
  • Gold or silver-equivalent totals and an in-ground value screen by category
Gold

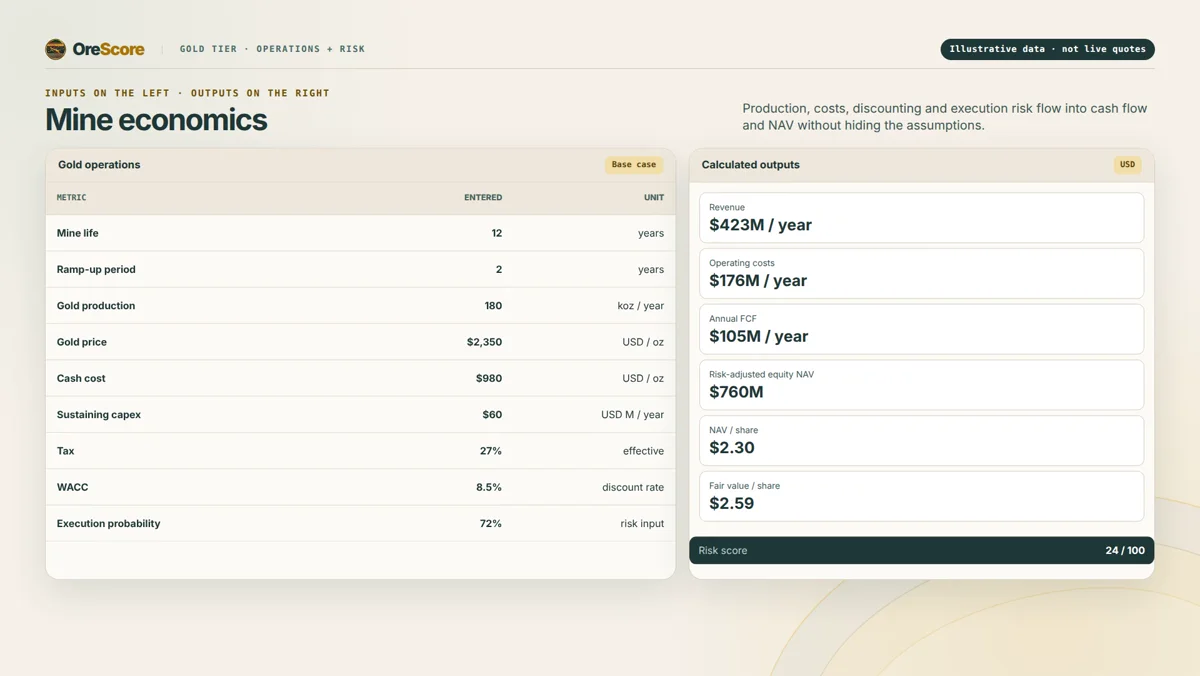
Build & operate

Model each mine on its own timeline, from build capital and first production through to closure.

  • Production, AISC, mine life and start year for every mine
  • Initial, sustaining and growth capex with closure cost
  • Year-by-year output, revenue, costs and free cash flow by mine
Gold

Risk lens

Score what could go wrong at each mine. Its risk factor cuts that mine’s NPV, so you see exactly where value is exposed.

  • Metallurgy, permitting and execution risk
  • Funding, jurisdiction and social / ESG risk
  • Watch flags specific to each mine
Gold

Sensitivity Analysis

Stress-test every case before you rely on one number.

  • Edit Bear, Base and Bull prices and every chart reruns
  • One change at a time, with step sizes you choose
  • Two-way grids and funding dilution, down to NAV per diluted share

Get
on board

Start with the free market snapshot, then add depth when you need it.

Valuation layers
5

Every formula in view, from snapshot to NAV

Screen gold, silver and copper miners, then trace how each input moves value per share.

Gold, silver and copper

Your research workspace.

Saved companies

Sync valuation snapshots to your account and open them on any device. Silver saves up to 15 companies.

Side-by-side comparison

Compare companies on the same screen and download comparison snapshots. Included with Gold membership.

Mining stocks & metal prices

Quotes and charts for mining stocks beside gold, silver and copper reference prices, which never change your model inputs.

Granular data you control

Every mine is broken down into production, costs, capex, royalties, tax, risk and resources by category. Change any input, case price or sensitivity step and every chart and figure reruns at once.

News and guides

Jump to Junior Mining Network, CEO.CA or MINING.COM, and read the methodology and metal guides without leaving the workspace.

Save and export

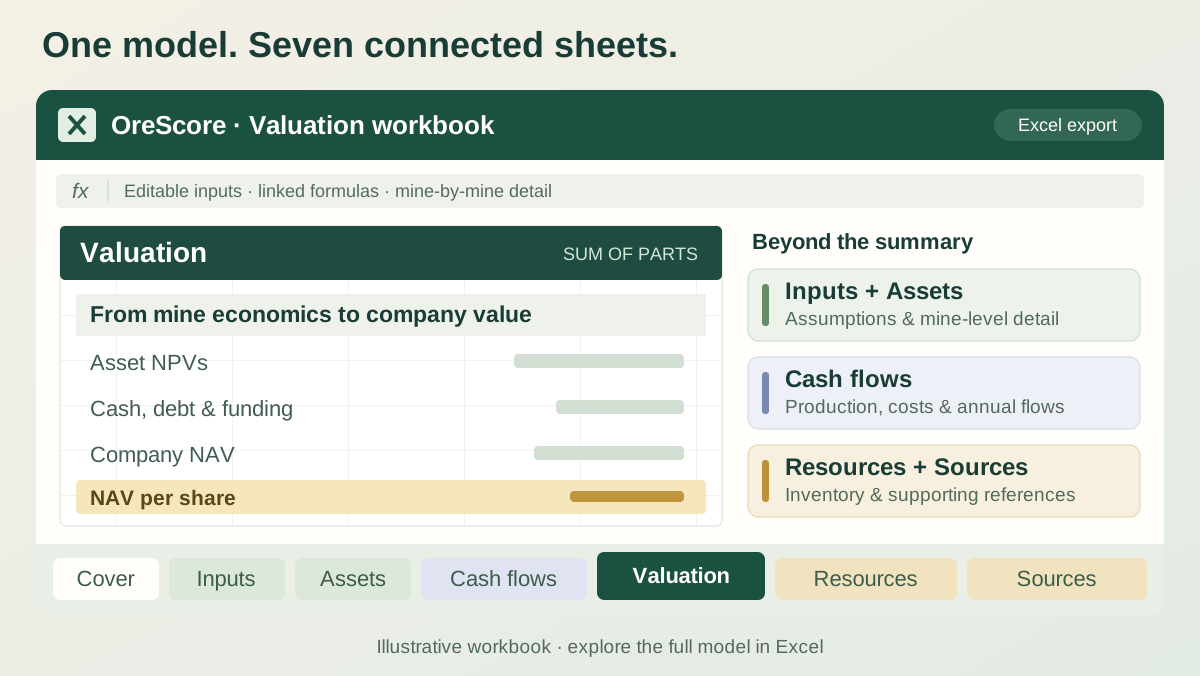
Save a company with Silver membership or Gold membership. Gold members can export an Excel workbook with live formulas and work in USD, CAD, GBP or another currency.

Choose how
deep to go.

The core market snapshot stays free. Paid memberships renew annually until cancelled.

Free

£0 forever

Fast market screening for every investor.

  • Market snapshot
  • Gold and Silver production economics
  • Basic calculation outputs from your inputs
Start free

Silver

£10 per year

Geological context and a focused saved-company library.

  • Everything in Free
  • Ad-free
  • Resource inventory
  • Grade, recovery and confidence weighting
  • Save up to 15 companies
View Silver

Prices are as shown on orescore.net at the time of writing. Check the membership page for current terms.